Local Anisotropic Tension-Stiffening Augmentation
When using a concrete damage model, tension stiffening is represented by the local anisotropic tension-stiffening augmentation [4]. With an anisotropic damage model, this method replaces the previous, globally acting approach: instead of describing the tension zone of the cross-section once via a single stress-strain curve valid for the entire cross-section, it superimposes a reinforcement-induced tensile stress on the basic material response of the concrete at each concrete integration point. The correction is calculated locally (per integration point) and anisotropically (separately in both principal strain directions); the angle between the reinforcement direction and the respective principal tension direction is explicitly taken into account.
Activation Factor
At each concrete integration point, the principal strains ε1, ε2 and the associated principal strain angle θp are determined; only tension directions (εk > 0) are relevant for tension stiffening. Each reinforcement layer j contributes to the activation factor αk of the principal direction k via three multiplicative partial factors:
|
Δαj,k |
Contribution of the reinforcement layer j to the activation factor of the principal direction k |
|
gj |
Capacity factor of the reinforcement layer j |
|
aj,k |
Angle factor between the reinforcement layer j and the principal direction k |
|
pj |
Position factor of the reinforcement layer j |
|
εs,j |
Strain of the reinforcement layer j |
|
εc |
Concrete strain |
|
z |
Location along the cross-section thickness (depth coordinate) |
|
Δθ |
Angle between the reinforcement direction and the principal tensile direction |
- gj (capacity factor): decreases with increasing reinforcement strain and becomes zero when the yield strain of the reinforcement is reached.
- aj,k (angle factor): for the anisotropic damage model, 1 for parallel and 0 for perpendicular alignment of reinforcement and principal tension direction, and the complement for the respective other principal direction. For the isotropic damage model, a different calculation applies without complement formation, yielding the same value for both principal directions, which can still be non-zero at exactly 90° under biaxial tension; see the banner "Scope by material model" above.
- pj (position factor): 1 within the concrete cover zone of the considered reinforcement layer, decreasing outside (strain compatibility between concrete and reinforcement).
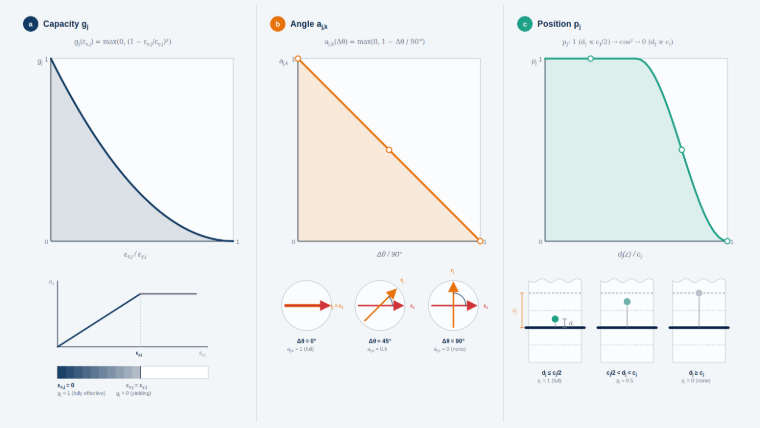
The contributions of all reinforcement layers are combined via a smoothed p-norm aggregator and limited to [0, 1]:
|
Δαj,k |
Contribution of the reinforcement layer j to the activation factor of the principal direction k |
|
p |
Exponent of the p-norm aggregator; the usual value is p = 8. Note: Do not confuse this with the position factor pj—same letter, different meaning. |
|
αk |
Activation factor of the principal direction k |
Target Stress Curve: Two Variants
The target stress in principal direction k is obtained as:
|
αk |
Activation factor of the principal direction k |
|
εk |
Principal strain in the direction k |
|
σtarget,k |
Target stress in the principal direction k |
|
σ̂(ε) |
Target voltage curve, according to Quast or modified Quast; see the respective section |
Two variants are available for the underlying target stress curve σ̂(ε), based on the two following subsections:
| Variant | Target stress curve based on | Behavior | Recommendation |
|---|---|---|---|
| according to Quast | Section "Quast" | enforcing: can both add and remove tensile stress in order to drive the mean response to the target value | for calibration to a specified mean tensile stress-strain behavior |
| according to Quast, modified | Section "Modified Approach According to Quast" | purely additive (Δσk ≥ 0): adds tensile stress only if the target value exceeds the current concrete stress | default setting (numerically more robust) |
Notes for Existing Models
Quast
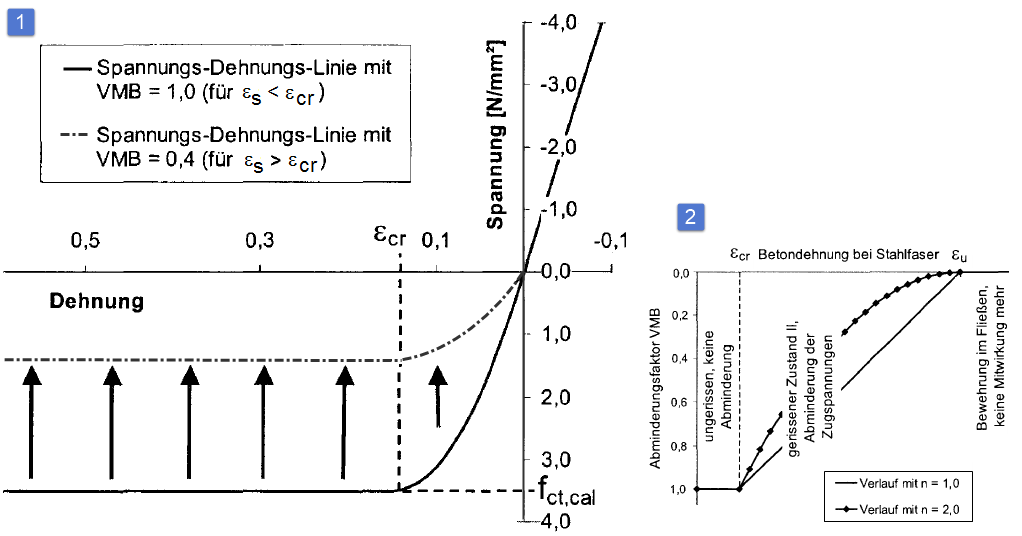
This model for capturing the contribution of the concrete in tension between the cracks is based on a defined stress-strain curve of the concrete in the tension zone (parabola-rectangle diagram).
The basic assumptions of the approach by Quast can be summarized as follows:
- Full contribution of the concrete in tension up to reaching the crack strain εcr or the calculated concrete tensile strength fct,R.
- Reduced stiffening contribution of the concrete in the tension zone according to the existing concrete strain.
- No application of tension stiffening after the yielding of the governing reinforcement bar.
In summary, this means that the calculated tensile strength fct,R is not a fixed value but relates to the existing strain in the governing steel (tension) fiber. The maximum tensile strength fct,R decreases linearly to zero from the defined crack strain εcr until the yield strain of the reinforcement steel is reached in the governing steel fiber. This is achieved by the stress-strain curve shown in the image below in the tension zone of the concrete (parabola-rectangle diagram) and the determination of a reduction factor VMB (stiffening contribution of the concrete).
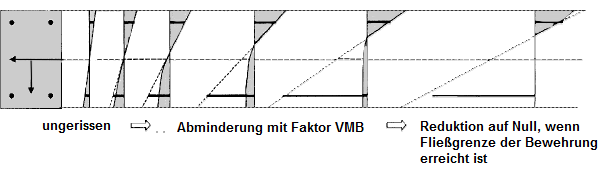
The next image schematically shows the stress states for increasing loading with tension stiffening.
The stress-strain curve in the tension zone can be described by the following equations:
for 0 < ε < εcr for ε > εcr- The fullness of the parabola in the first section can be controlled by the exponent nPR.
- The exponent should be adjusted such that the transition from the compression to the tension zone occurs with the same modulus of elasticity as much as possible.
To determine the reduction factor VMB, the strain at the most heavily tensioned steel fiber is used. The position of the reference point is illustrated in the following graphic.

The reduction factor VMB decreases with increasing steel strain. In the diagram for the factor VMB (see image below), it can be seen that the factor VMB is reduced exactly to zero at the onset of yielding of the reinforcement.
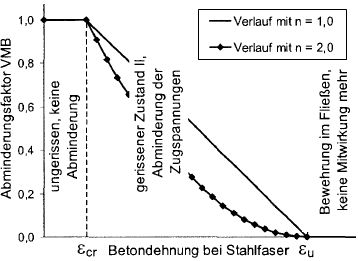
The curve of the reduction factor VMB in State II (ε > εcr) can be controlled via the exponent nVMB.
- According to Pfeiffer [2], values of nVMB = 1 (linear) to nVMB = 2 (parabola) are empirical values for components subjected to bending stress.
- Quast [3] uses the exponent nVMB = 1 (linear) in his model and thereby achieves good agreement in the recalculation of column tests.
- According to Pfeiffer [2], pure tension tests can be represented with nVMB = 2 with acceptable agreement.
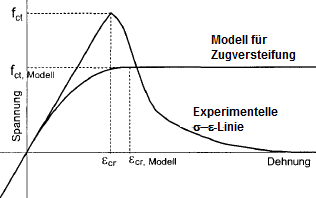
The assumption of a parabola-rectangle diagram for the cracked concrete tension zone is to be regarded as a computational aid. At first glance, there are large differences compared to experimentally determined stress-strain curves on the tension side of plain concrete.
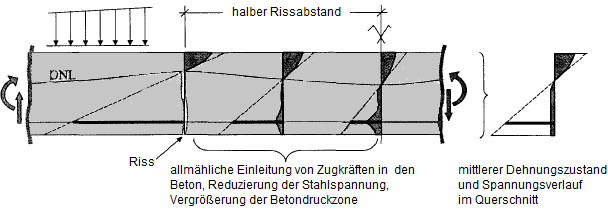
When considering the existing stresses in the reinforced concrete cross-section subjected to bending stress, it becomes apparent that the parabola-rectangle diagram is indeed better able to describe the strains and stresses on average. In a bending beam, a concrete body forms between two cracks. This acts as a kind of wall into which tensile forces are gradually re-introduced by the reinforcement. As a result, a very irregular distribution of stress and strain develops. On average, however, a strain plane with a parabola-rectangle course can be constructed, by means of which the mean curvature can be captured.
For the Quast model, the design values to be used were proposed as follows
- for the tensile strength fct,R
- for the crack strain εcr,R
The design value for the tensile strength fct,R is thus smaller than the specifications of the Eurocode. This is justified by the description of the stress-strain curve and the determination of the reduction factor VMB, in which the assumed tensile stress and the resulting tensile force are only gradually reduced after the tensile strain is exceeded. At a strain of 2 ⋅ εcr, an effective tensile stress of about 0.95 ⋅ fct,R still results. Thus, the reduction of the stiffness can be well predicted for bending stress. For pure tensile stress, the values given above for fct,R are too low. Here, according to Pfeiffer [2], the values from EC 2 should be used for the design value of the tensile strength. The values recommended by Quast [3] for fct,R = 1/20 ⋅ fcm can be achieved by assuming 60% of the tensile strengths specified in EC 2. When assuming fct,R = 0.6 ⋅ fctm, on the one hand, cracking of the cross-section is predicted too early. On the other hand, however, a reduction of the tensile strength under permanent load (approx. 70%) or a temporarily higher load (e.g., the short-term application of the rare action combination), which leads to a damaged tension zone, is already taken into account. The individual design values for the tension zone of the concrete can be described as follows:
Modified Approach According to Quast
The modified approach according to Quast uses the same definition of the calculated tensile strength fct,R and the crack strain εcr,R as the approach according to Quast (see previous section). The difference lies in the manner of application to the concrete stress, not in the target curve itself:
- With the approach according to Quast, the concrete stress in the tension zone is directly set to the value of the target curve (σc = σ̂(ε), see target curve in section "Quast"); compared to the stress of the unmodified basic material model, this can mean both an increase and a reduction.
- With the modified approach, the target curve is instead purely additively superimposed on the concrete stress σc,Basis(ε) provided by the basic material model (e.g., damage model).
|
σ̂(ε) |
Target stress curve, according to Quast or modified Quast; see the respective section |
|
σc |
Concrete stress in the tension zone |
|
σc,Basis(ε) |
Concrete stress in the base material model, for example, a damage model |
|
Δσc |
Additive tension stiffening factor applied to the concrete stress |
|
σc |
Concrete stress in the tension zone |
|
σc,Basis(ε) |
Concrete stress of the base material model, for example, a damage model |
|
Δσc |
Additive tension stiffening factor for concrete stress |
The concrete stress can thus only be increased by the tension stiffening, never reduced. This additive procedure is numerically more robust than the enforcing variant according to Quast, since it does not lead to an abrupt stiffness jump when the basic material stress already exceeds the target curve.