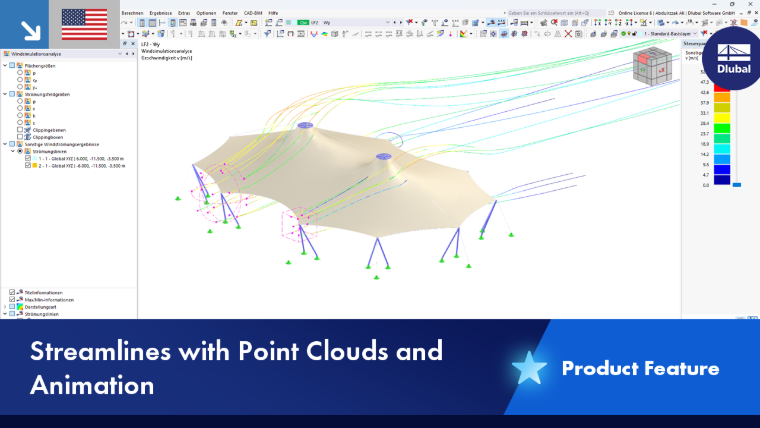
Point clouds enable a flexible representation of streamlines in the wind simulation analysis. They allow you to define points that are distributed randomly or uniformly in the 3D space of areas of the model. These points represent so-called "seed points" of a regular or irregular grid in a user-defined area. From these starting points, the streamlines are calculated in order to visualize a flow field. The placement of these points determines which flow structures are visible (vortices, separation zones, stagnation points).
Defining Point Cloud
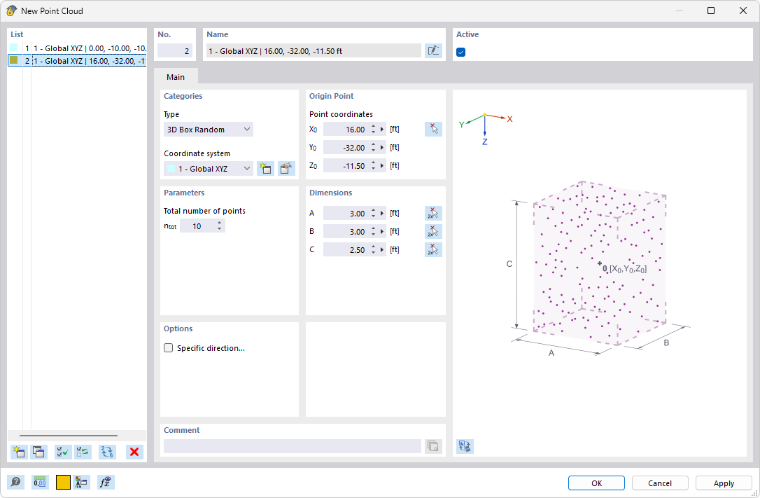
Categories
In the list, select the 'type' of point cloud. Several geometric shapes and options are available:
- 3D box random: spatial arrangement of random points in a cuboid
- 3D box: spatial arrangement of regular points in a cuboid
- Rectangle: planar arrangement of regular points in a rectangle
- Segment: uniform arrangement of points along a line
- Sphere: spatial arrangement of uniformly distributed points in a sphere
- Circle: planar arrangement of uniformly distributed points in a circle
Parameters
Specify the 'total number of points' to be generated in the point cloud. For a uniform arrangement in a 3D box or a rectangle, you can also define the number of points for the directions.
Origin Point
Enter the 'point coordinates' that represent the center of the point cloud. Using the
 button, you can also define this point graphically.
Dimensions
The input options are adapted to the type of point cloud. For a 3D box, the size of the cuboid is described by the dimensions that are applied symmetrically from the center in each of the three directions. Using the
 button, you can also define the distances graphically in the work window. For a sphere or a circle, enter the radius.
Options
If you tick the 'Specific direction' check box, you can align the point cloud independently of a coordinate system. Define the parameters in the 'Specific direction' tab (see chapter Nodal support).
Using Point Clouds
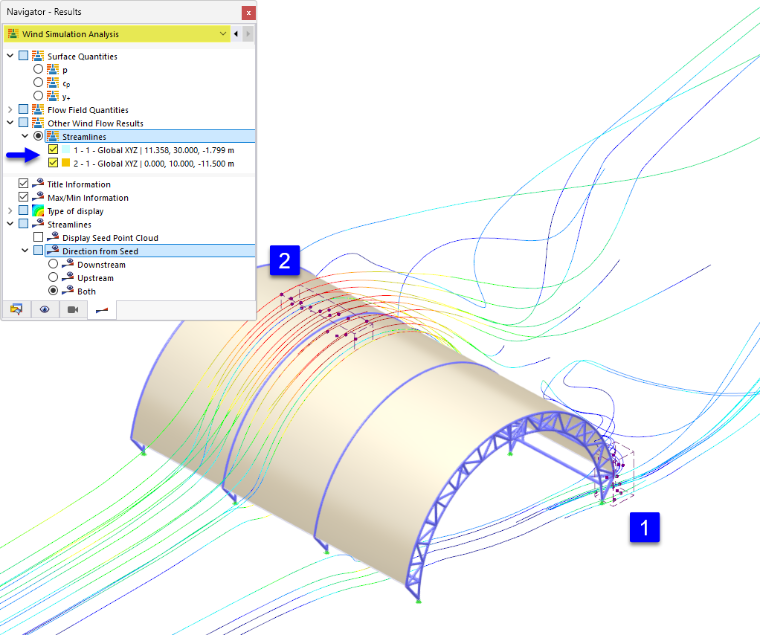
The points of a point cloud form the basis for the representation of streamlines. You can also define several point clouds and thus display and analyze the streamlines in independent sub-areas simultaneously. After the wind simulation analysis, the results are available for the point clouds that you can activate for display in the 'Navigator - Results'.
Streamlines of Point Clouds
In the Other wind flow results category, you can control which streamlines are displayed graphically:
- If no user-defined point cloud is activated, the results of the general seed points in the wind tunnel are displayed. These are generated by an algorithm using specific criteria.
- If you tick one or more point clouds, the results of the specific seed points within those areas are displayed.
In the lower Navigator section, in the Direction from seed category, you can define which streamlines are displayed starting from the seed points:
- Downstream: in the wind direction
- Upstream: against the wind direction
- Both: downstream and upstream
Animation of Streamlines
The streamlines of point clouds can also be displayed as motion sequences. Click the
 button in the toolbar to visualize the wind flow as an animation on the model.
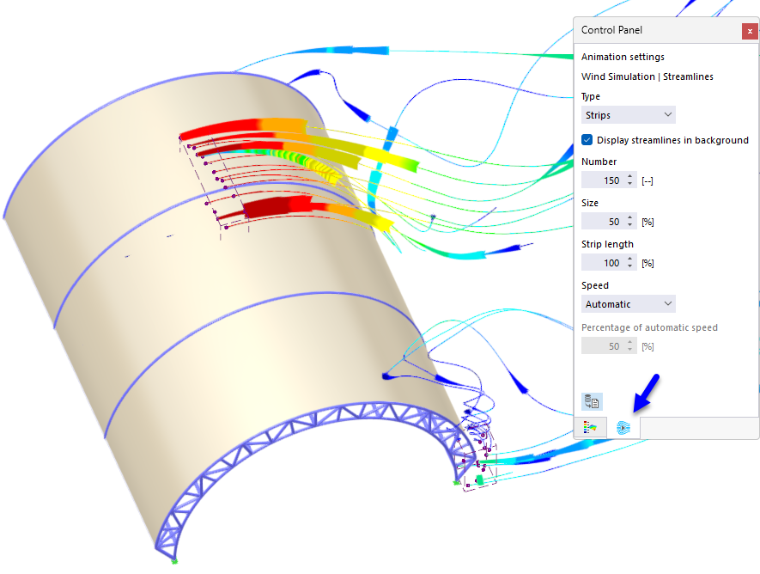
In the second tab of the control panel, you can adjust the animation settings such as the number, size, and length of the strips and the speed of the animation. The streamlines can be displayed not only as strips, but also as particles.