2026-07-14
027443
Result Diagrams in Section
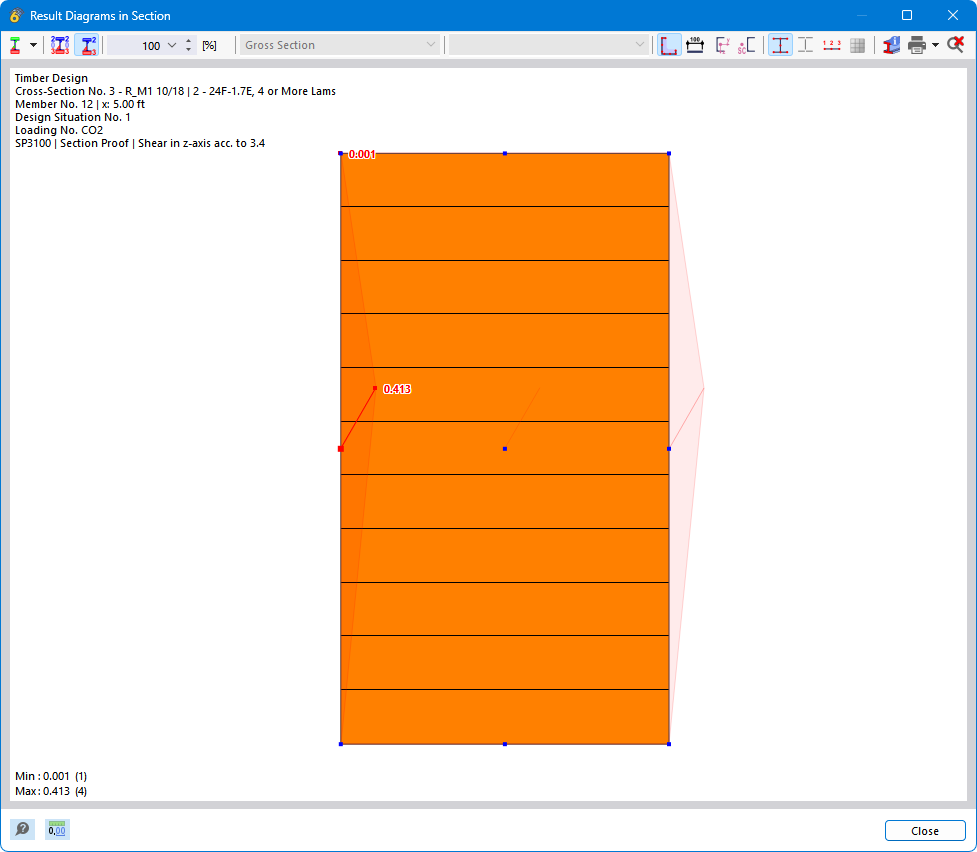
The image shows the stress distribution in the cross-section of a timber component. The clear display of the various stress regions illustrates the load distribution within the cross-section. Based on the graphical display, the critical areas and the structural strength can be efficiently evaluated.